Utility Data Widgets
Intuitive frontend widgets to complement powerful APIs, empowering users to understand and optimize their energy usage while reducing utility support calls.
Role:
Senior Product Designer
Timeline:
Q1 2024 - Present
Employer:
GridX, inc.
Employer size:
145 staff members
Team and Role
GridX, a growing SaaS company, are changing how utility companies interact with their customers across the United States. As part of this effort, I led the design of our Empower product line, a solution featuring a modular, customizable consumer data widgets.
As the sole designer on the Empower project, I worked closely with one product manager, collaborating with developers as needed. My role encompassed the entire design process, from initial concept to final implementation.
Key responsibilities included:
Leading the design of the modular, customizable widgets
Creating speculative designs for sales pitches
Refining designs based on client feedback and needs
Developing data visualizations and user journeys
Contributing to the design system and theming capabilities
Collaborating with the product manager to align design with business goals
Problem and Business Impact
Our key challenge was that utilities were purchasing Empower’s APIs but struggling to develop effective customer-facing interfaces. As a result, the APIs were underutilized, while utilities continued working to address common issues like call reduction and improving customer satisfaction.
Utility pain points:
High call volumes
High call volumes due to billing confusion and unclear energy usage data.
Customer frustration
Customer frustration about understanding their energy consumption and identifying ways to reduce costs.
Missed opportunities
Missed opportunities to promote rebates, offers, or savings programs effectively.
By bundling our APIs with modular, easy-to-implement frontend widgets, we could enhance product value for utility clients while empowering their customers. The goal was not only to provide data but also to guide users toward proactive behavior, reducing utility support calls and building trust.
Discovery
The heart of our process lay in deep collaboration with utility clients, relying on their feedback and user research to guide our design decisions and address end-customer needs.
End consumer pain points:
Billing Confusion
Users found it difficult to understand their charges and energy usage patterns.
Desire to save money
Many struggled to find actionable ways to lower their bills.
Low Engagement with Online Billing
Although current user engagement with online bills was low, it was expected to increase as utilities shifted more services online.
To validate the usability of the widgets, I conducted user testing using Maze.
Reframing the Problem
We recognized that offering data alone wasn’t enough—the key was to provide guided interactions that would help users understand and act on their energy insights.
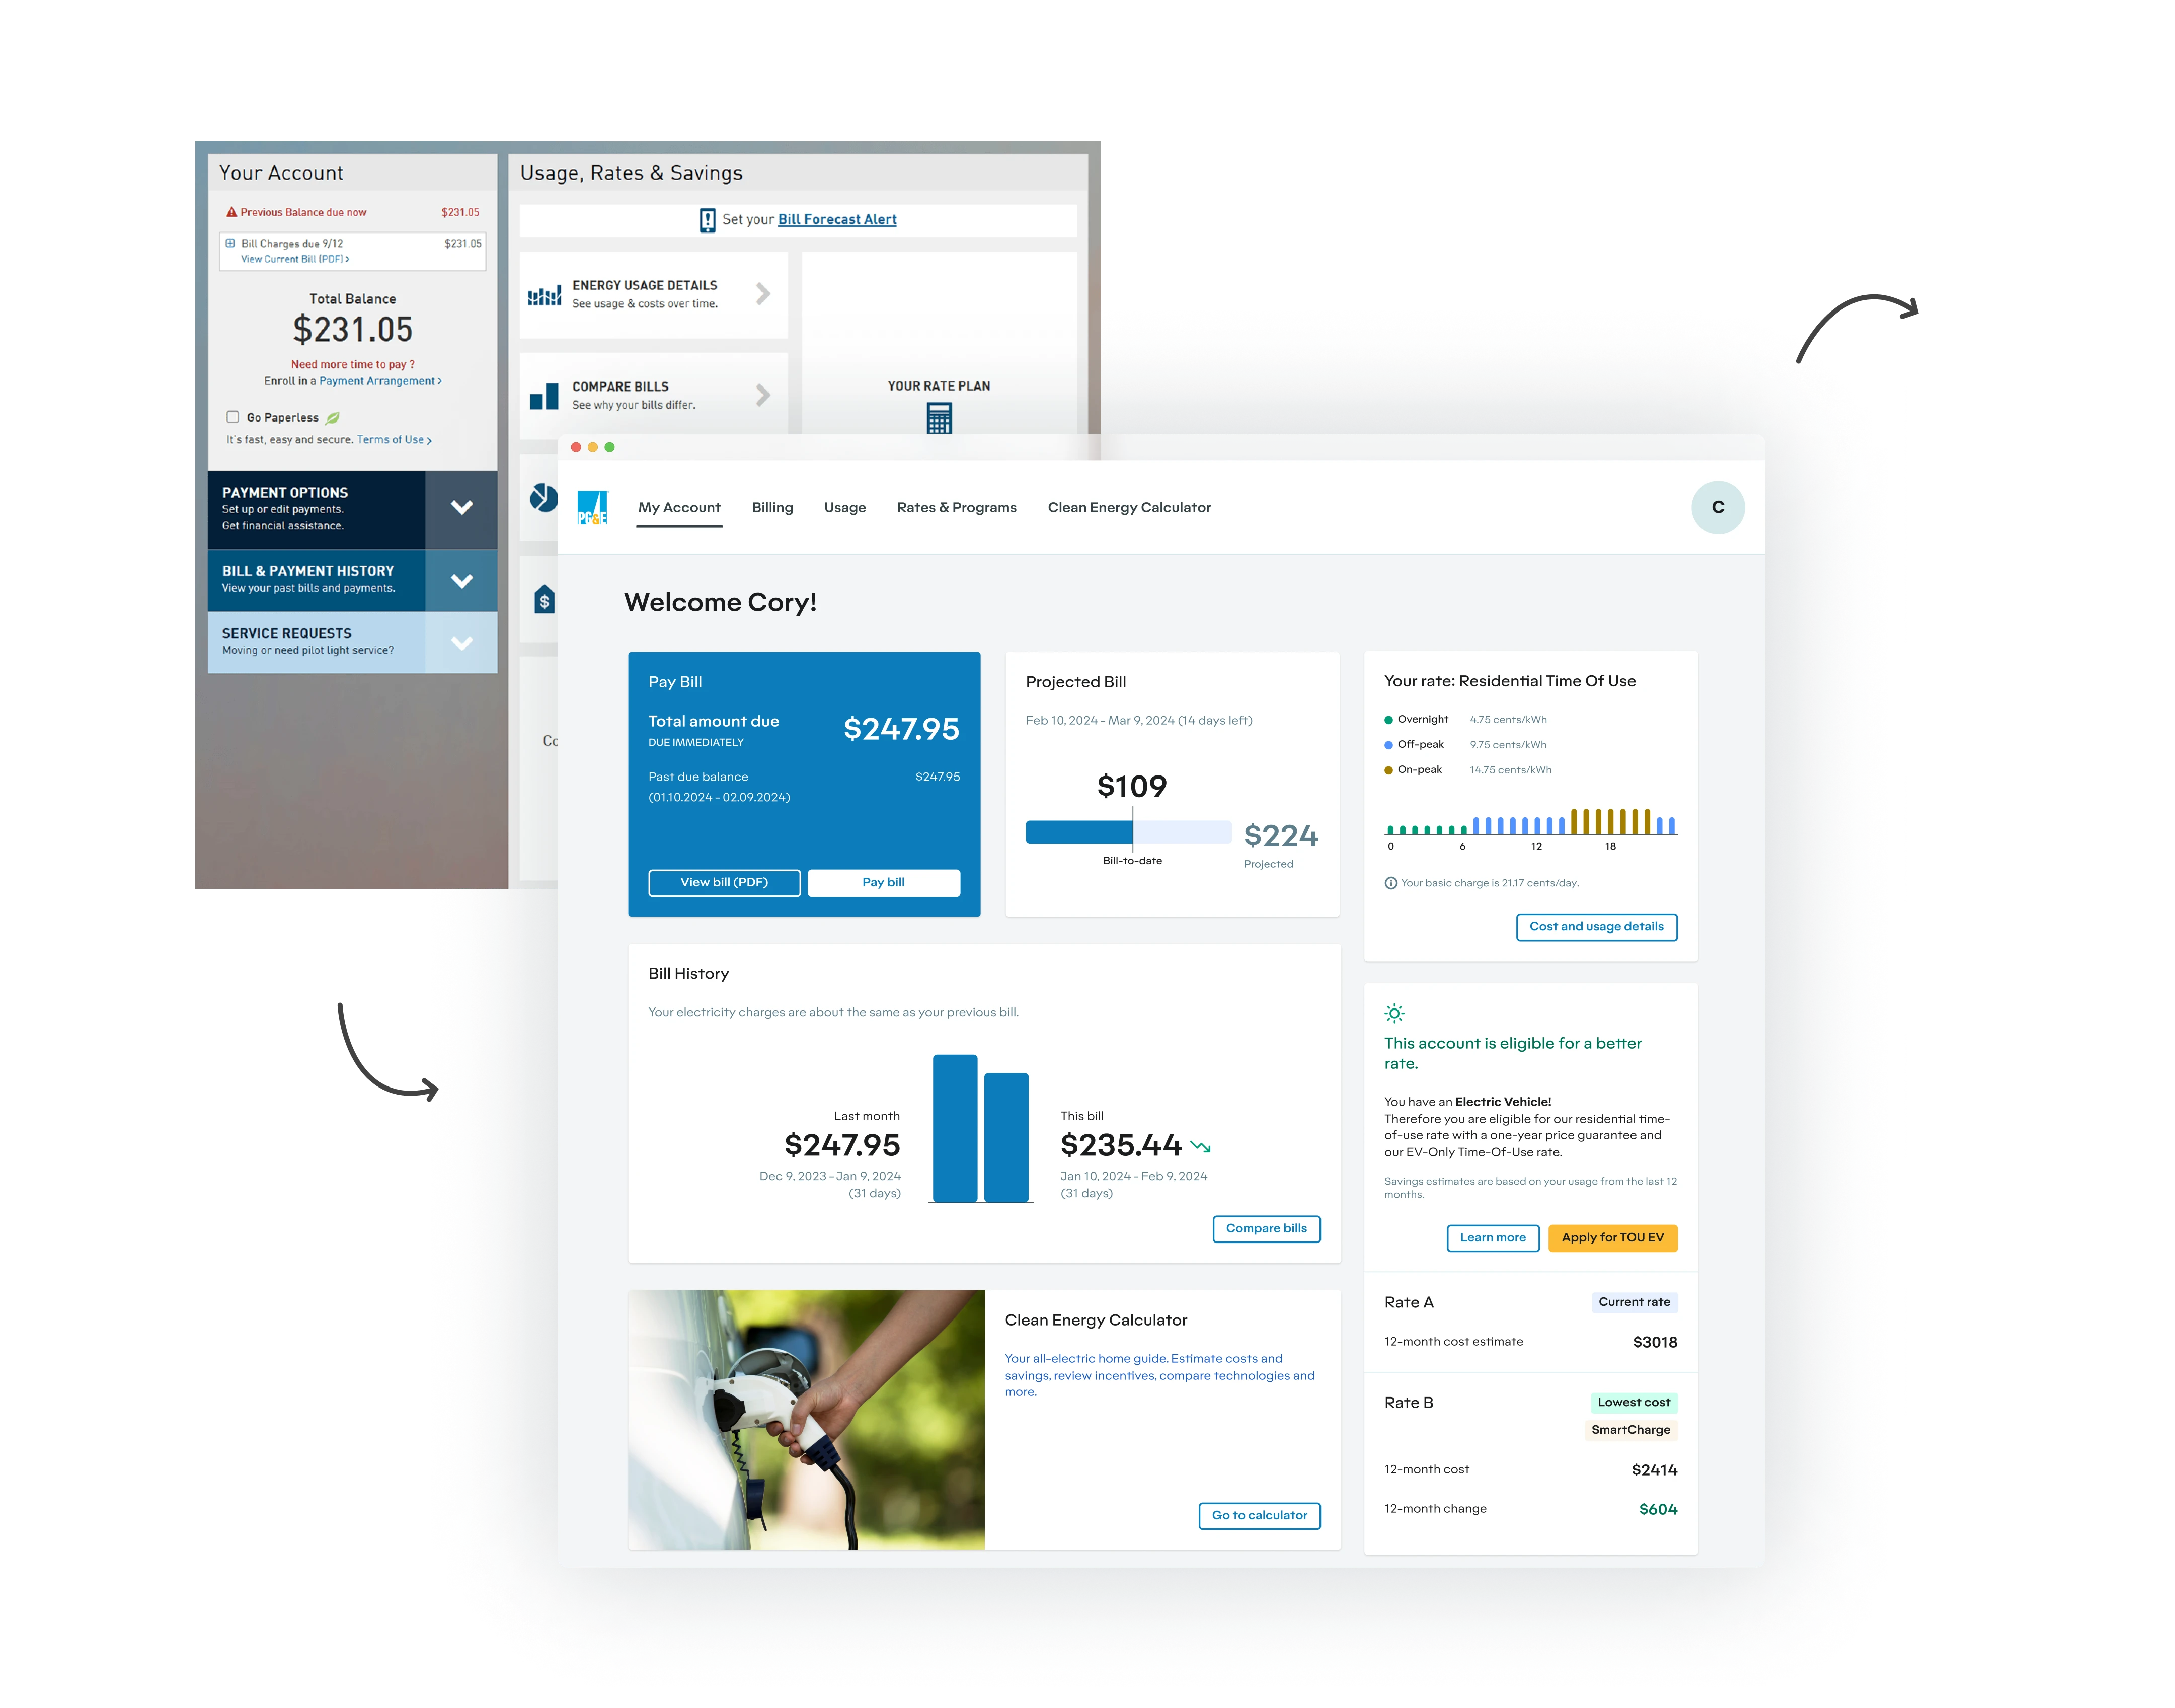
Our goal was to create a cohesive user journey, consulting utilities to use email notifications or login prompts and guiding users through progressively detailed insights.
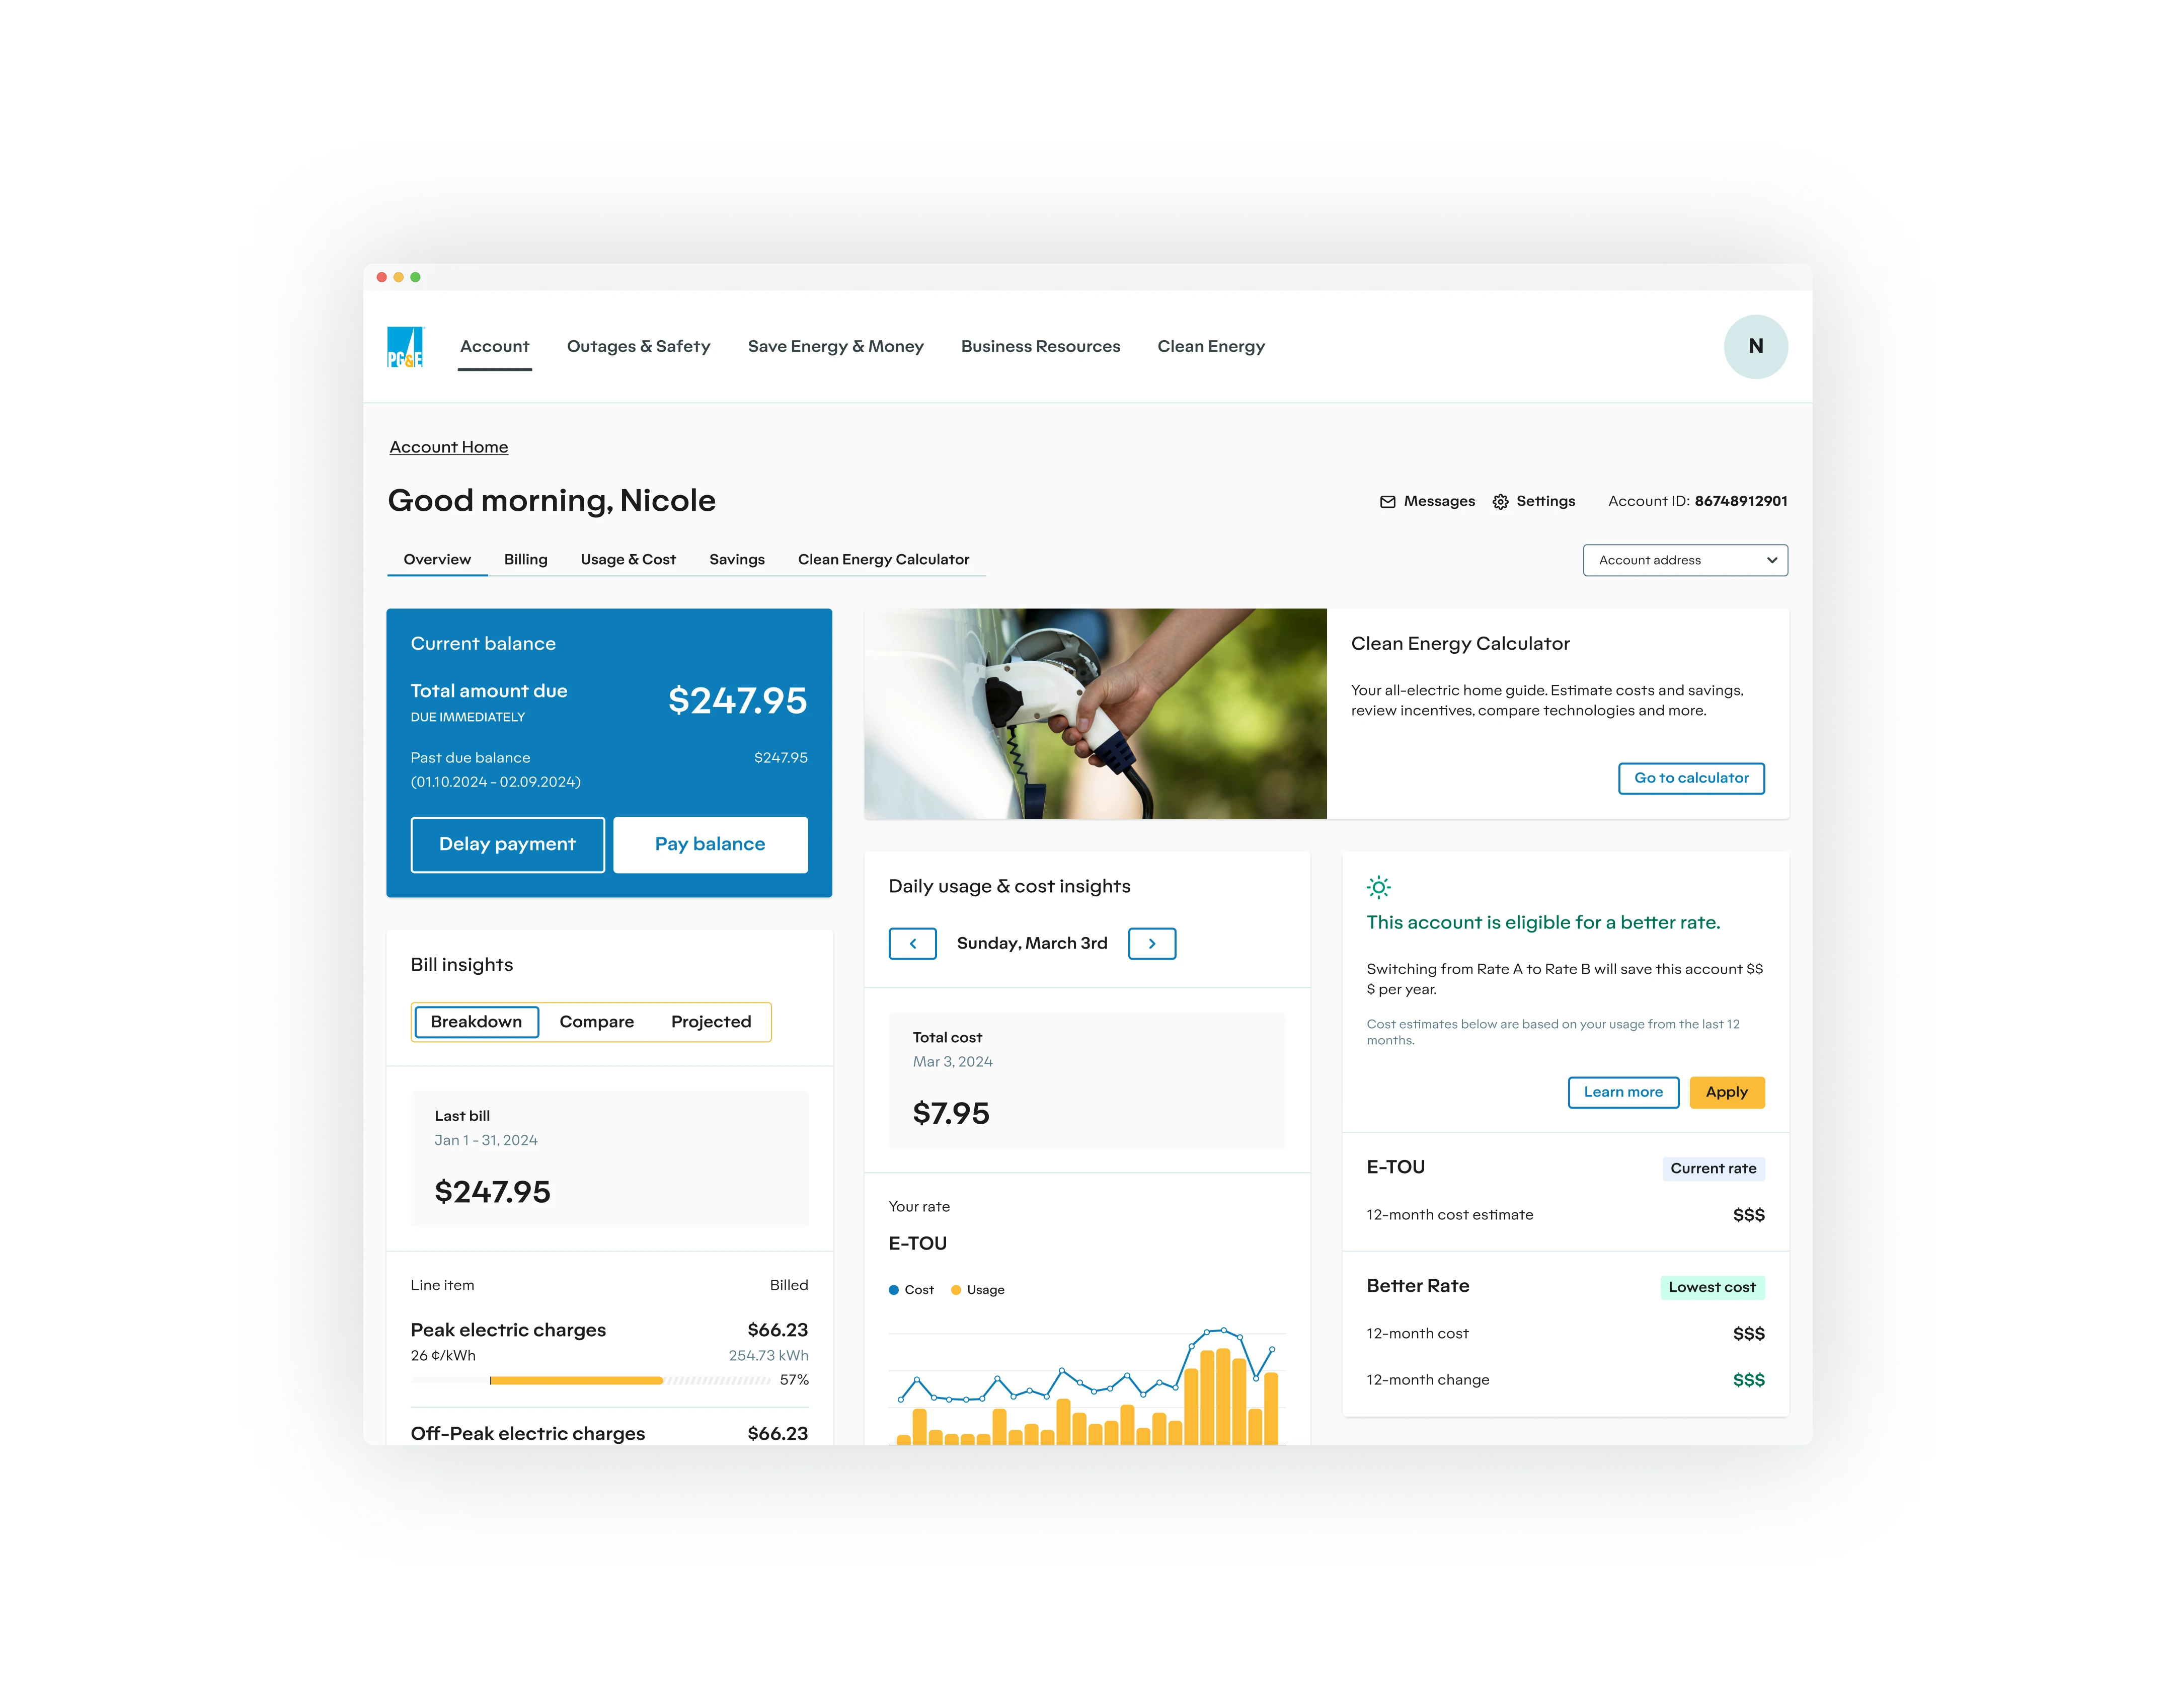
The logged-in front page experience became a critical focus: it needed to grab user attention with key data at a glance while encouraging deeper exploration into bill details.
For example, a user might start with a simple bill overview, then dive deeper into usage patterns, and finally receive personalized recommendations for energy-saving measures or clean energy adoptions.
Solution
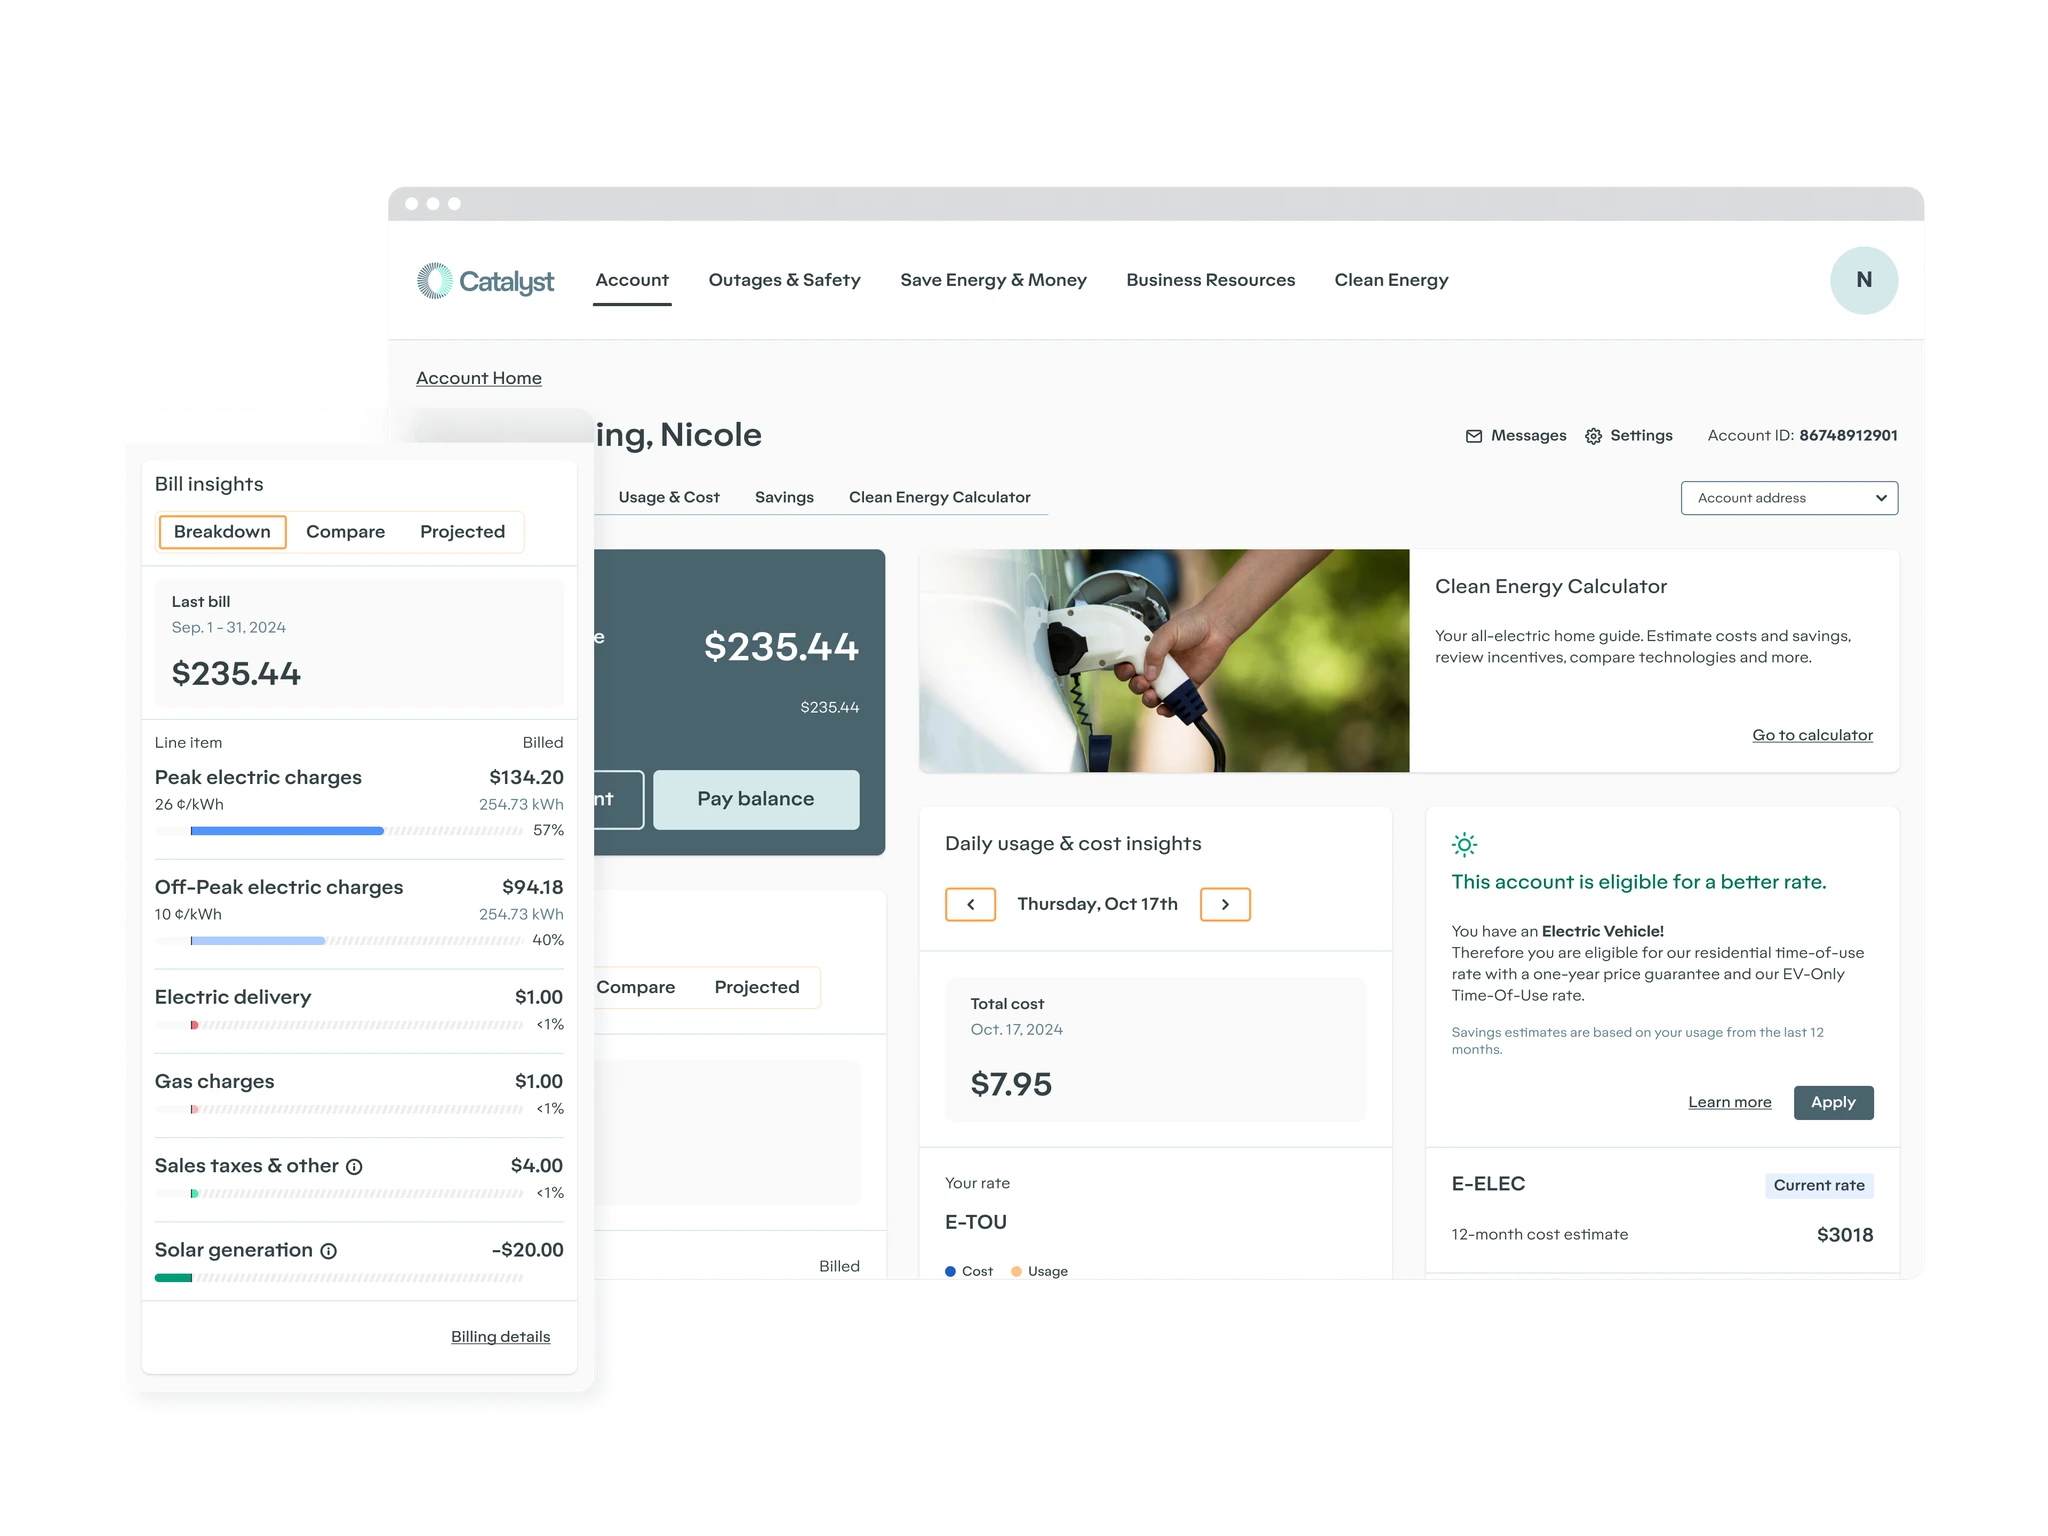
The core of Empower is its modular, scalable GridX API powered widgets that can meet diverse utility needs while delivering consistent value to end-users.
Each widget was designed to be self-contained yet interconnected, allowing utilities to choose the most relevant tools for their customers.
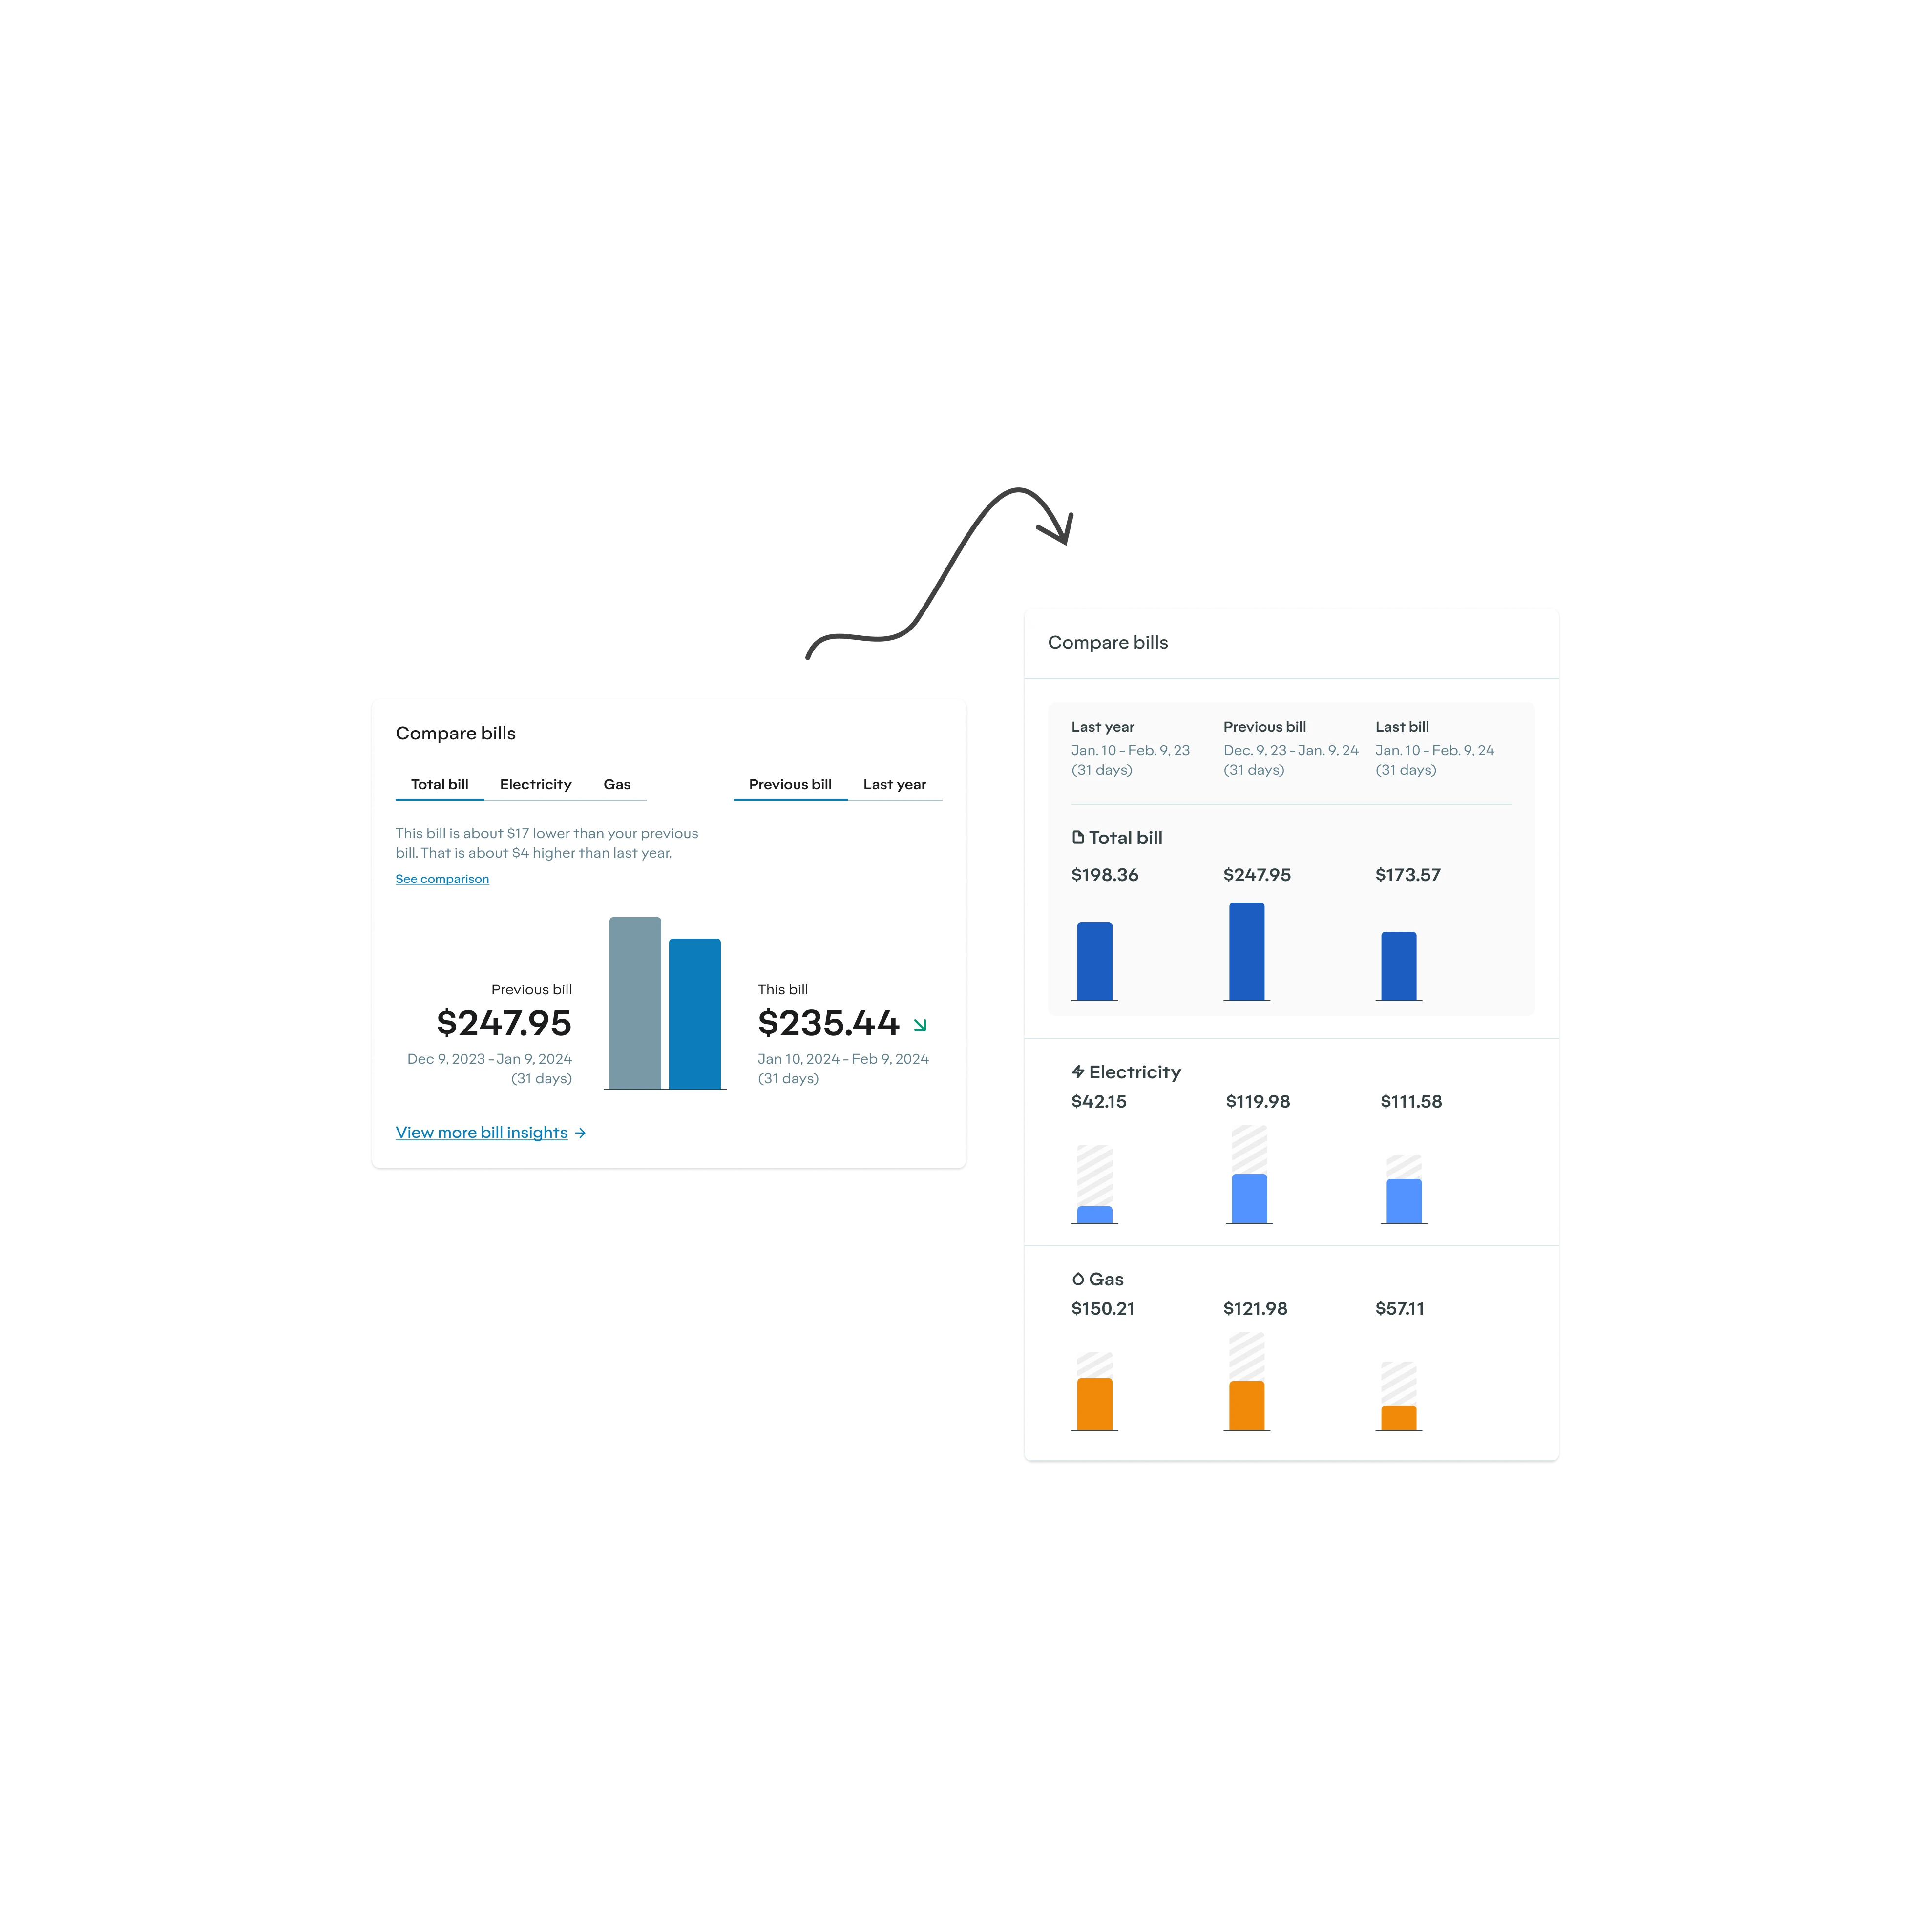
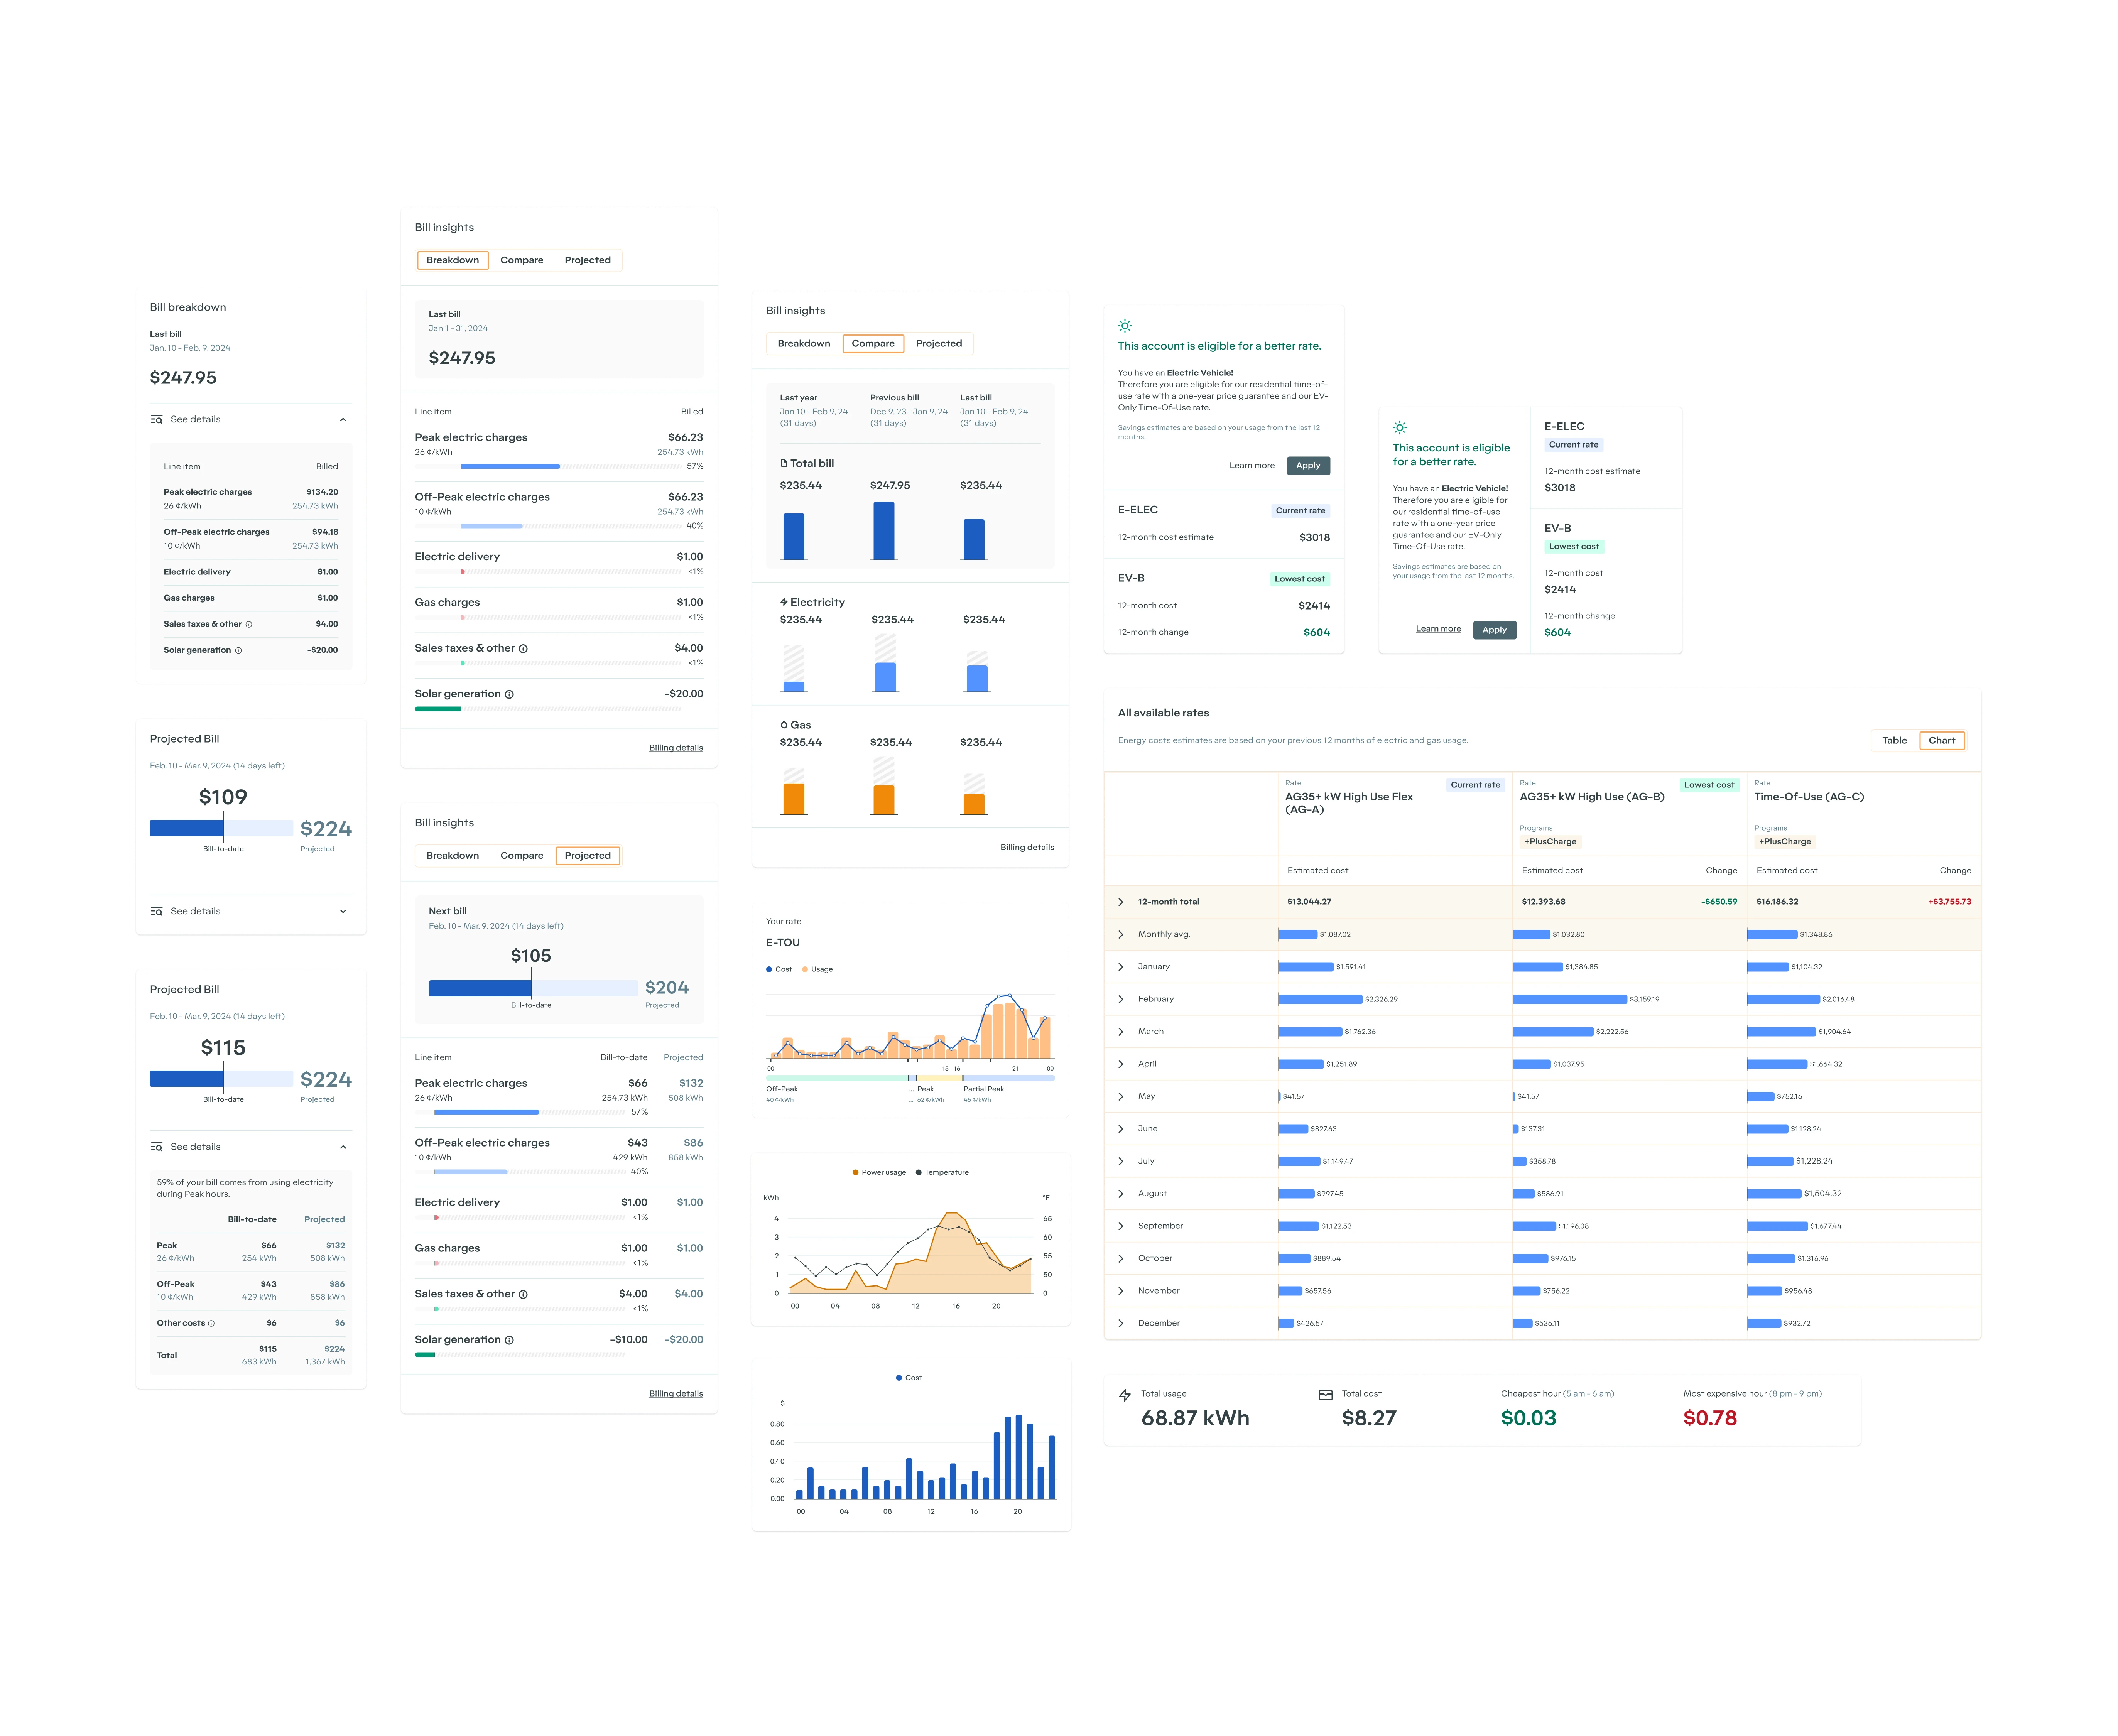
Data Visualization and Charts
One of the most critical aspects of Empower was presenting complex data in an easily digestible format. I focused on creating clear, intuitive charts and graphs that help users understand their energy usage and costs. This included developing custom visualization components that could adapt to different types of data and screen sizes.
Complementary Projects
While Empower was my main design responsibility, I also worked on other products and initiatives.
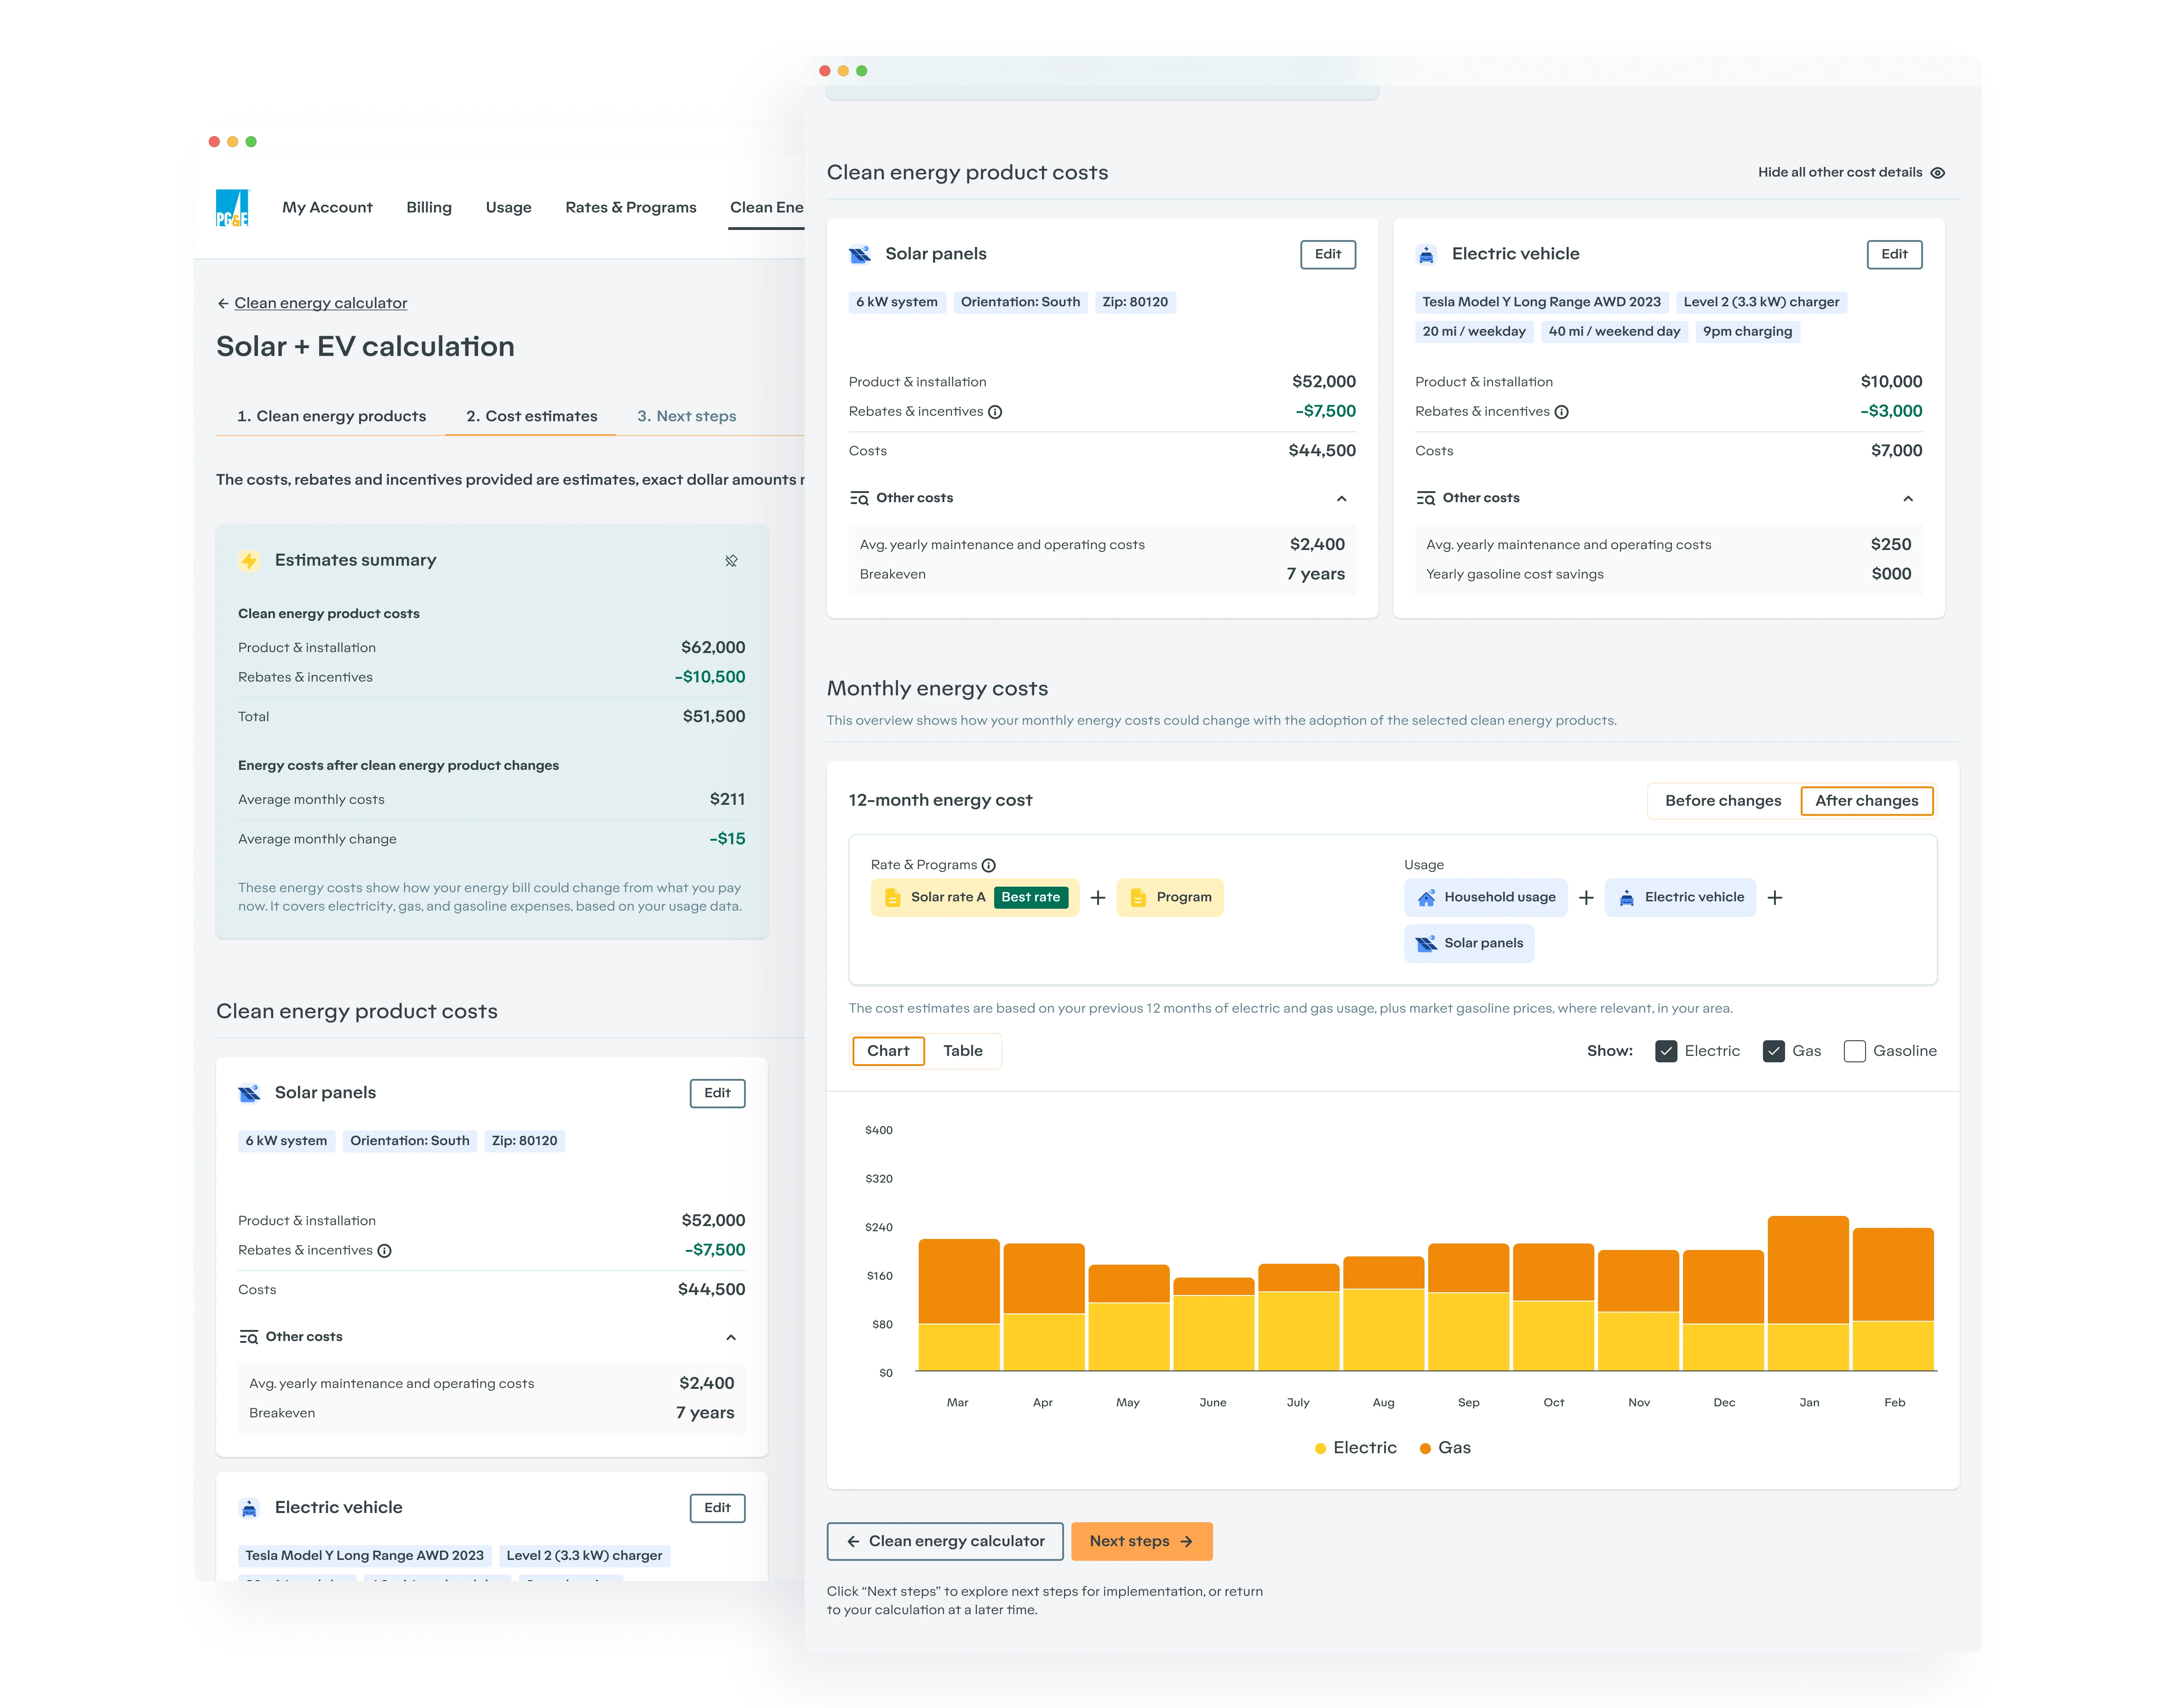
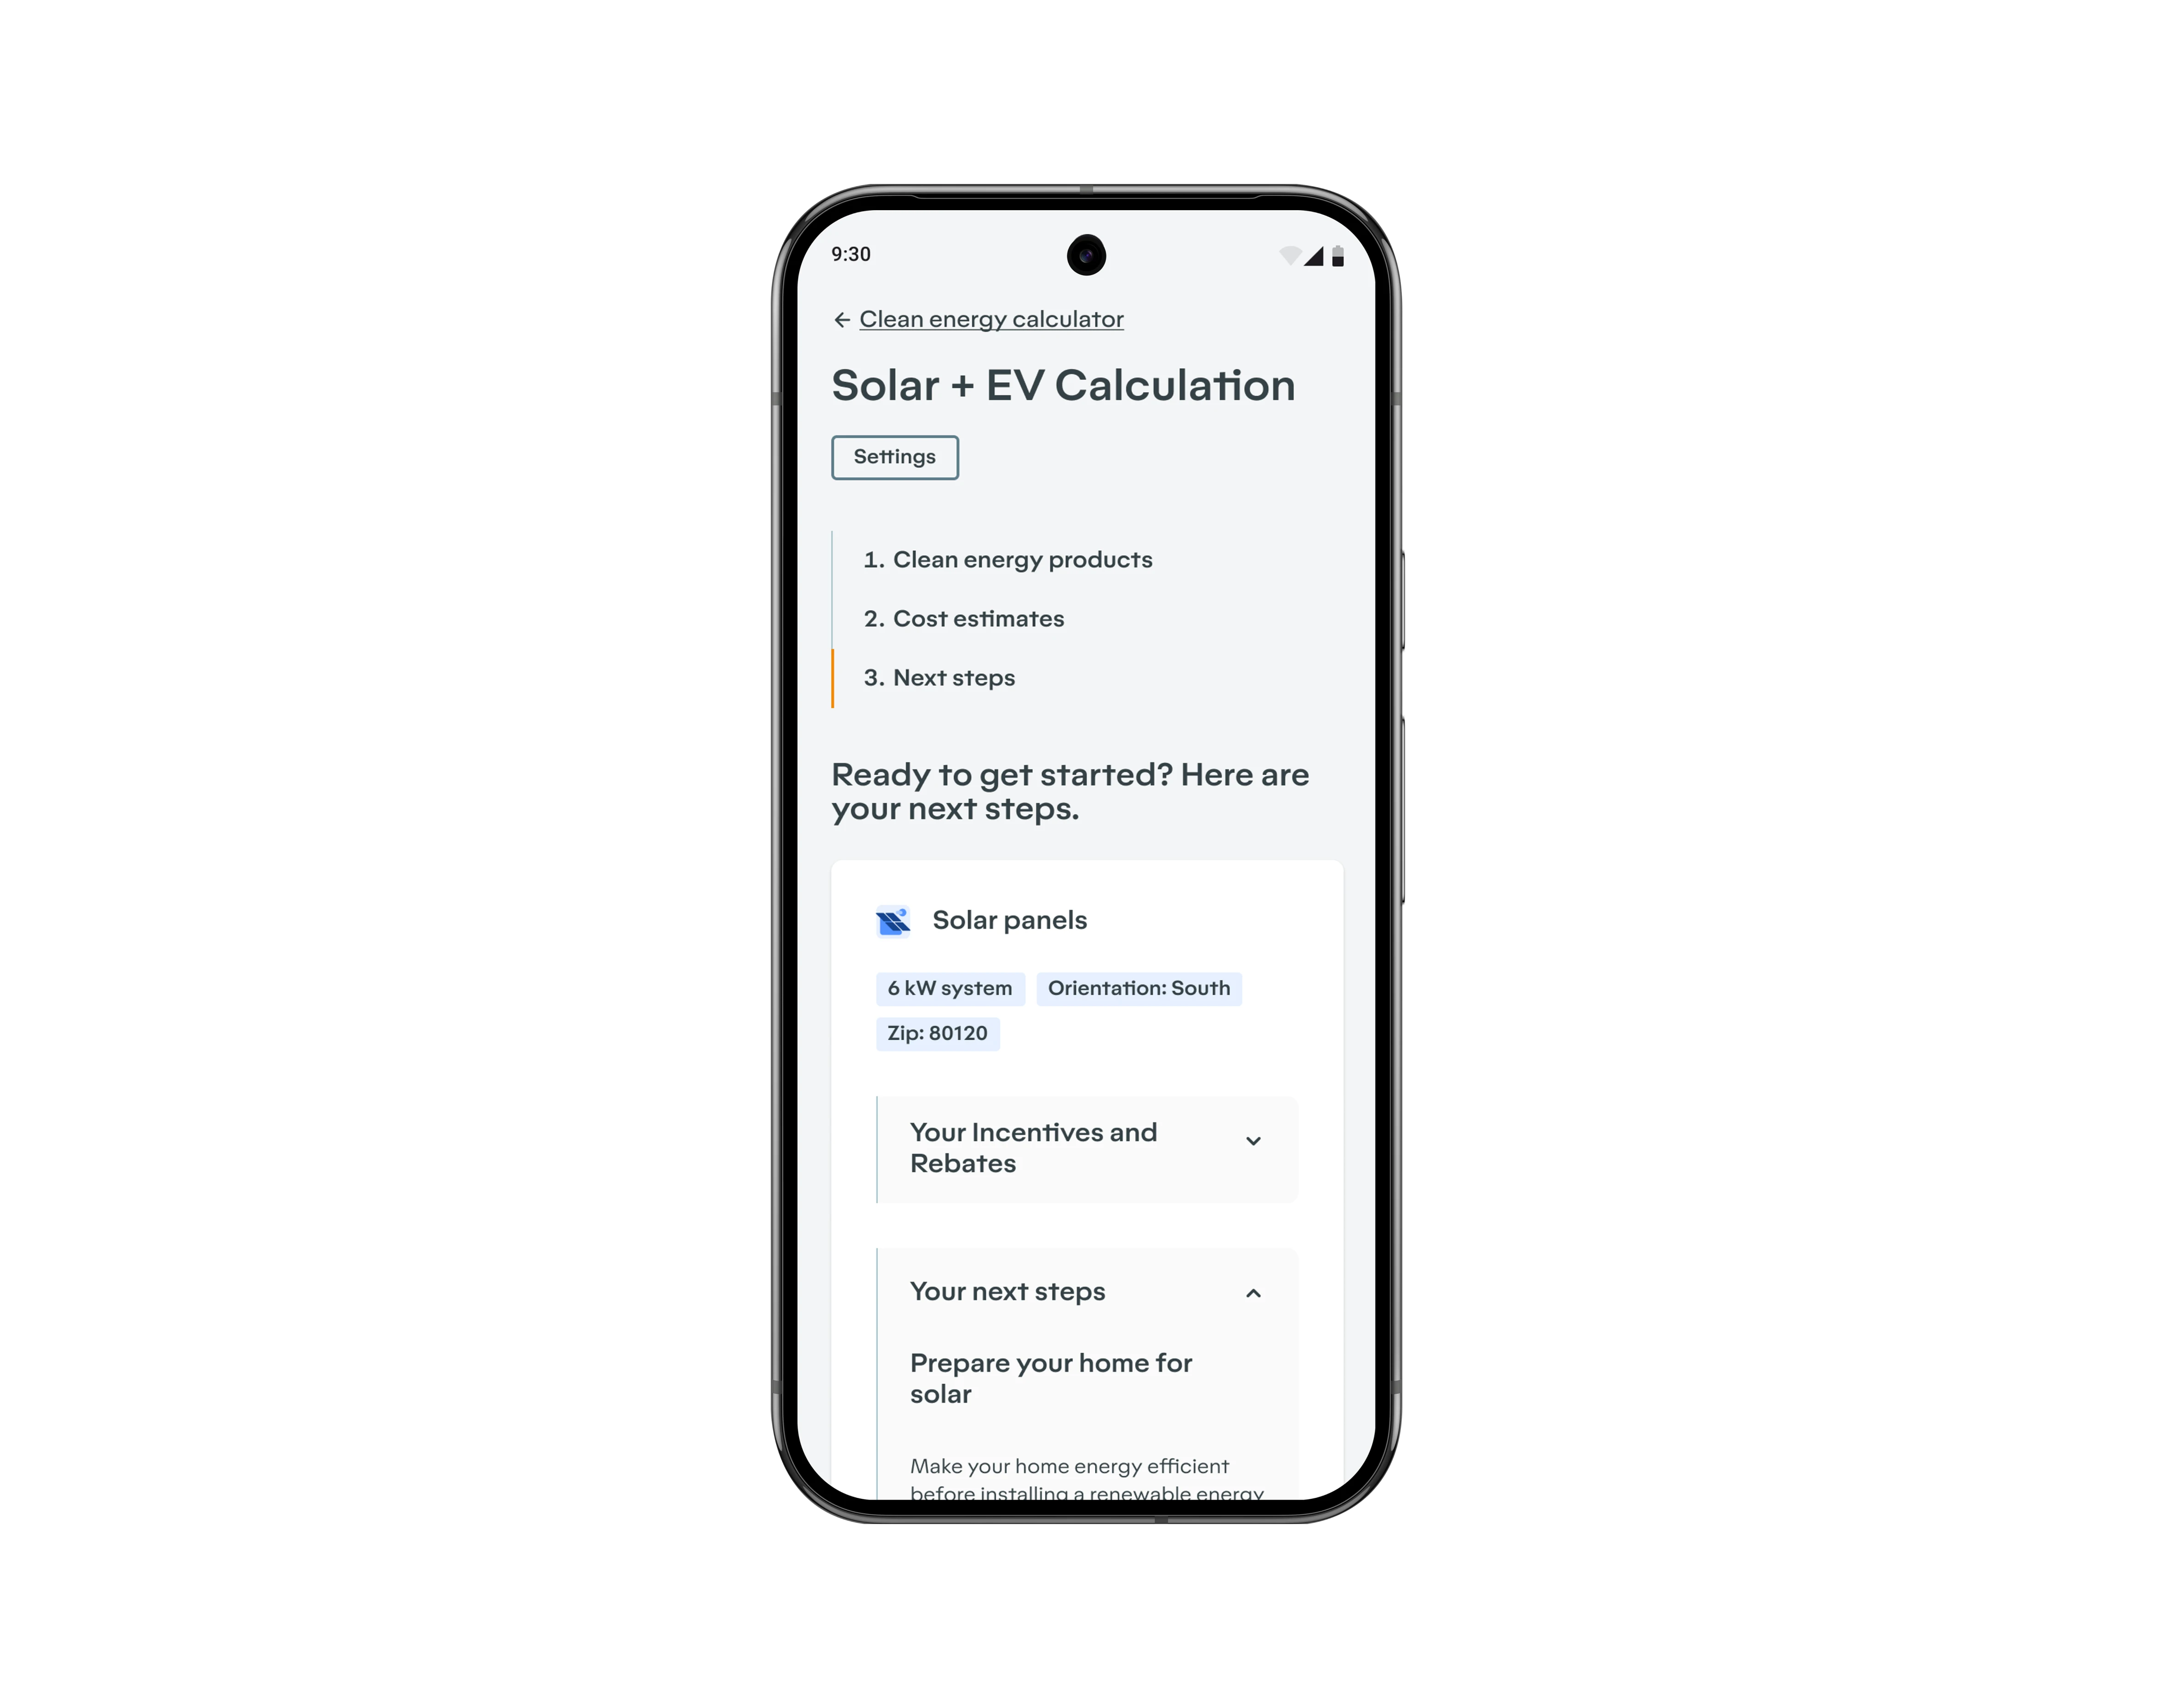
Explore Clean Energy Calculator
Alongside Empower, I worked on refining the Explore clean energy calculator. This tool allows customers to simulate the adoption of various clean energy technologies and see the potential impact on their energy bills. My work focused on improving the results and implementation pages, making it easier for users to understand the total cost of ownership for different energy solutions.
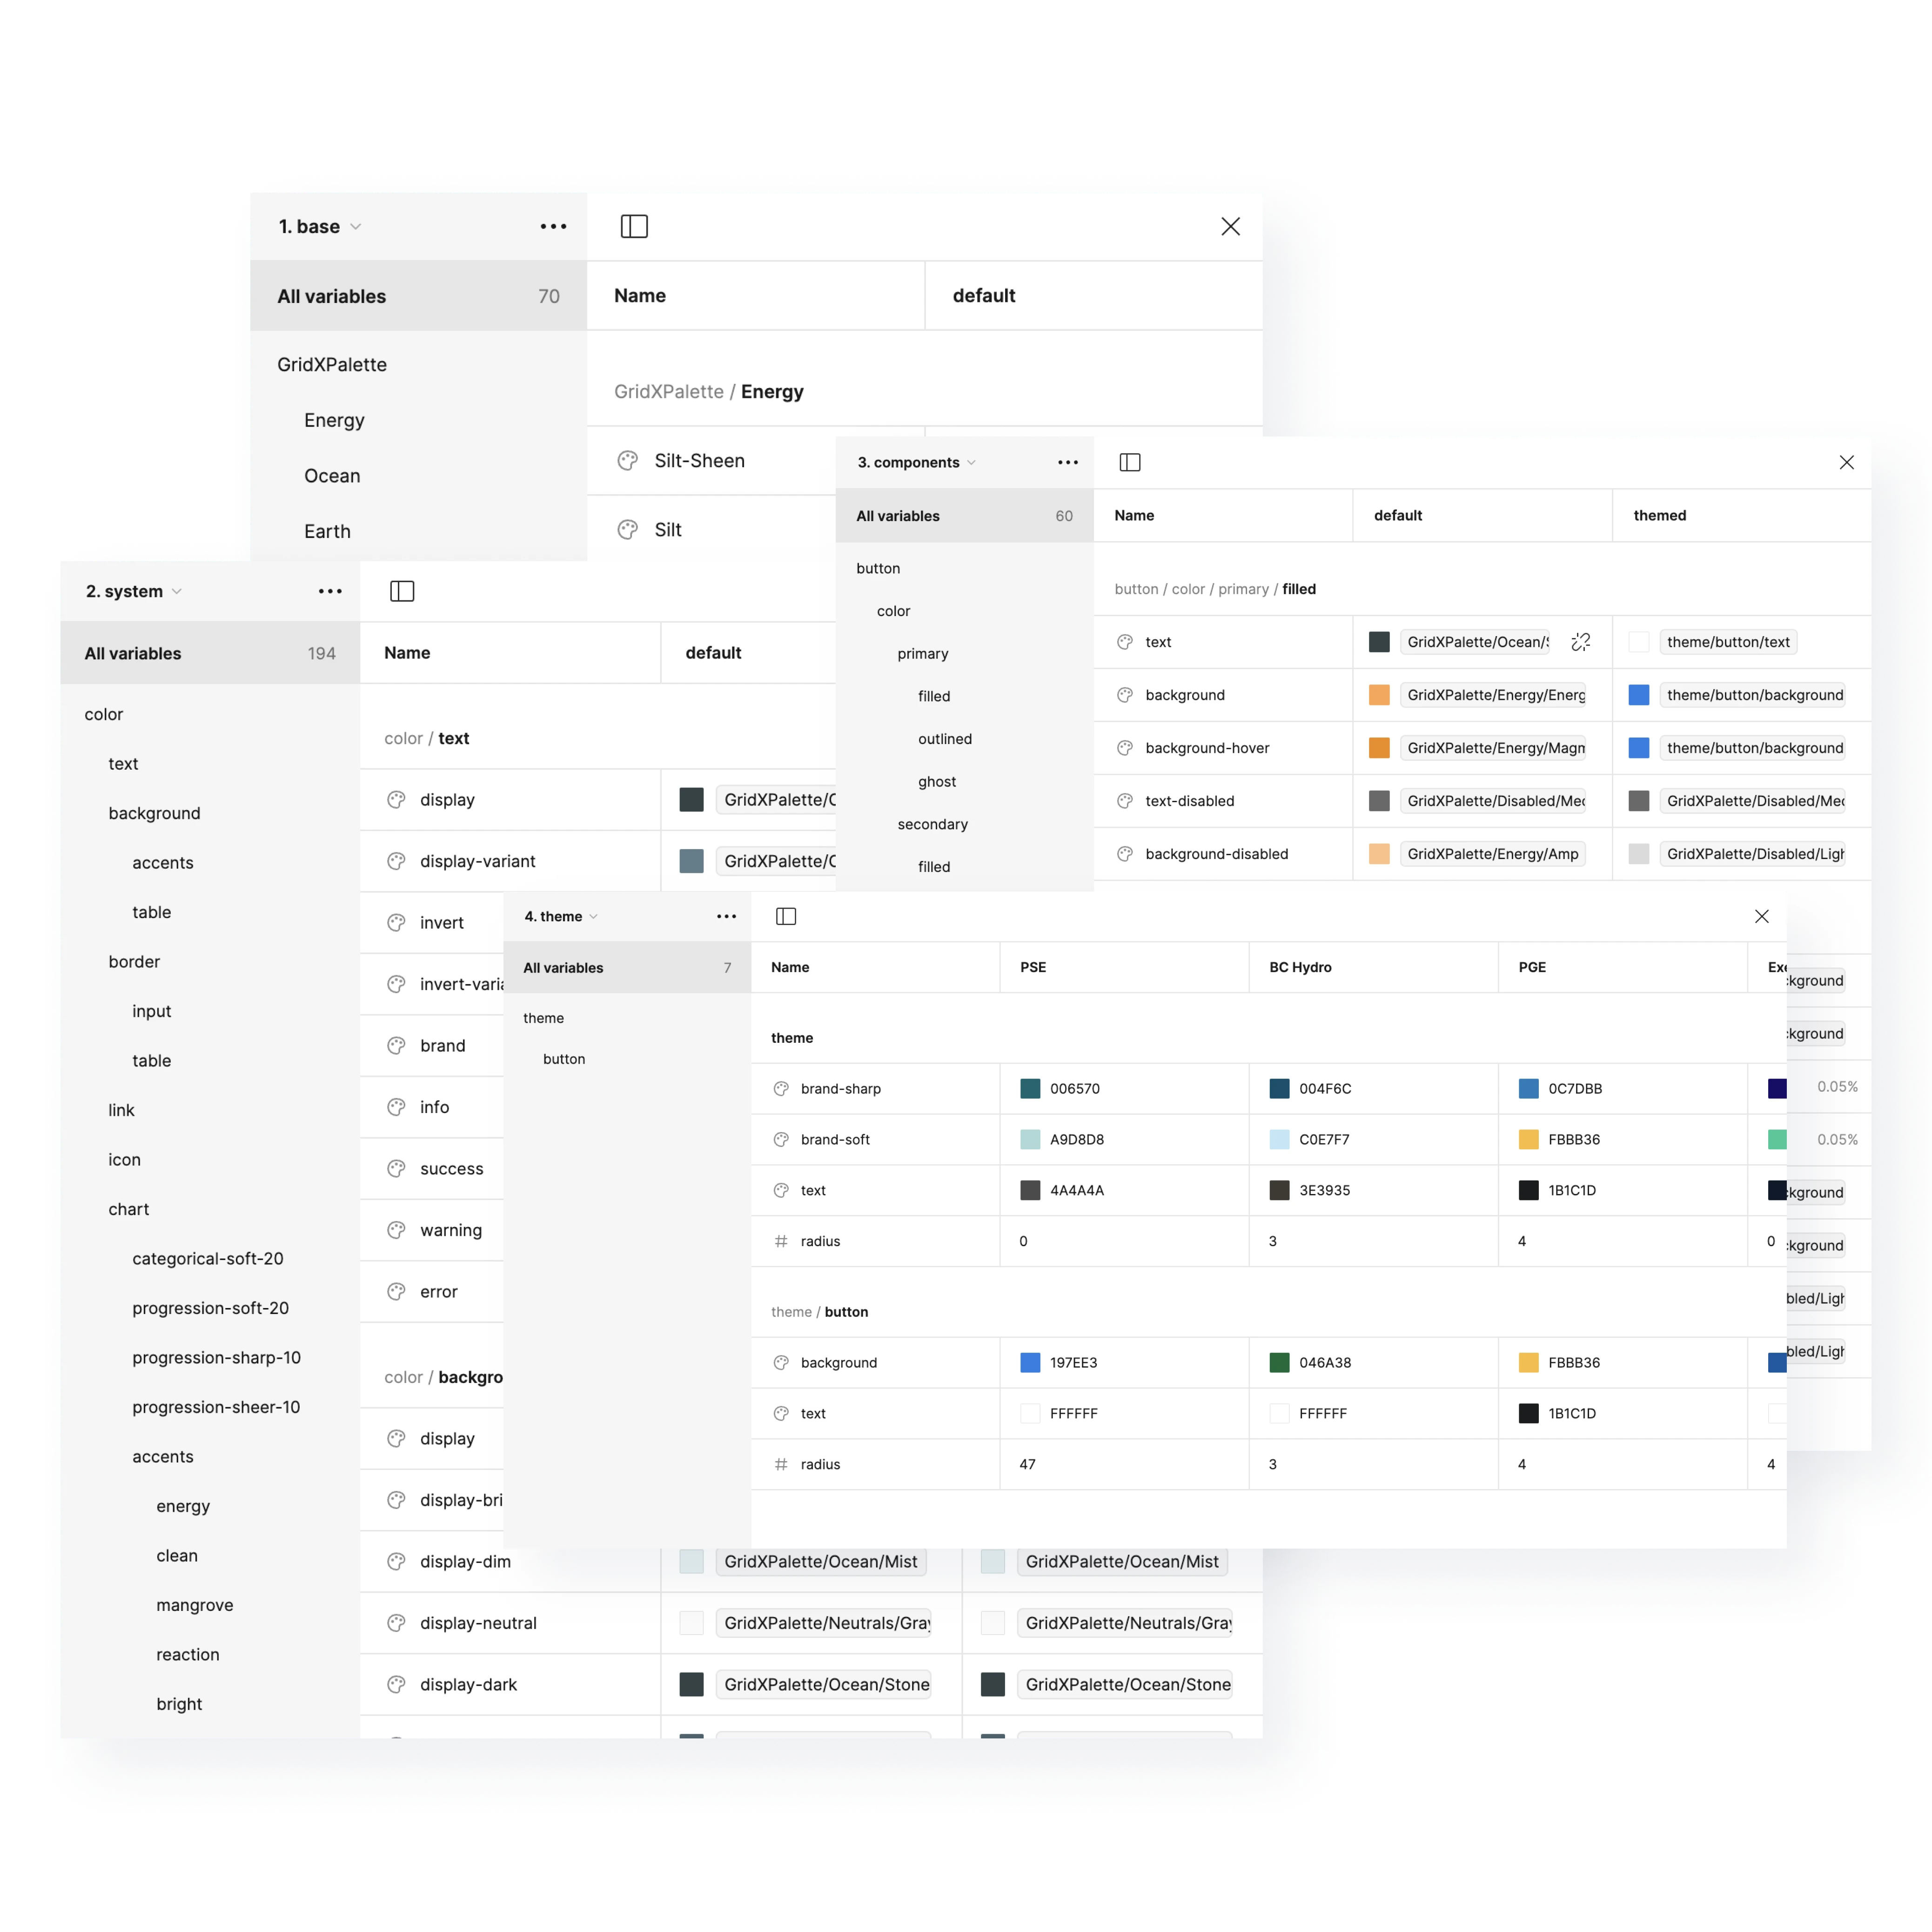
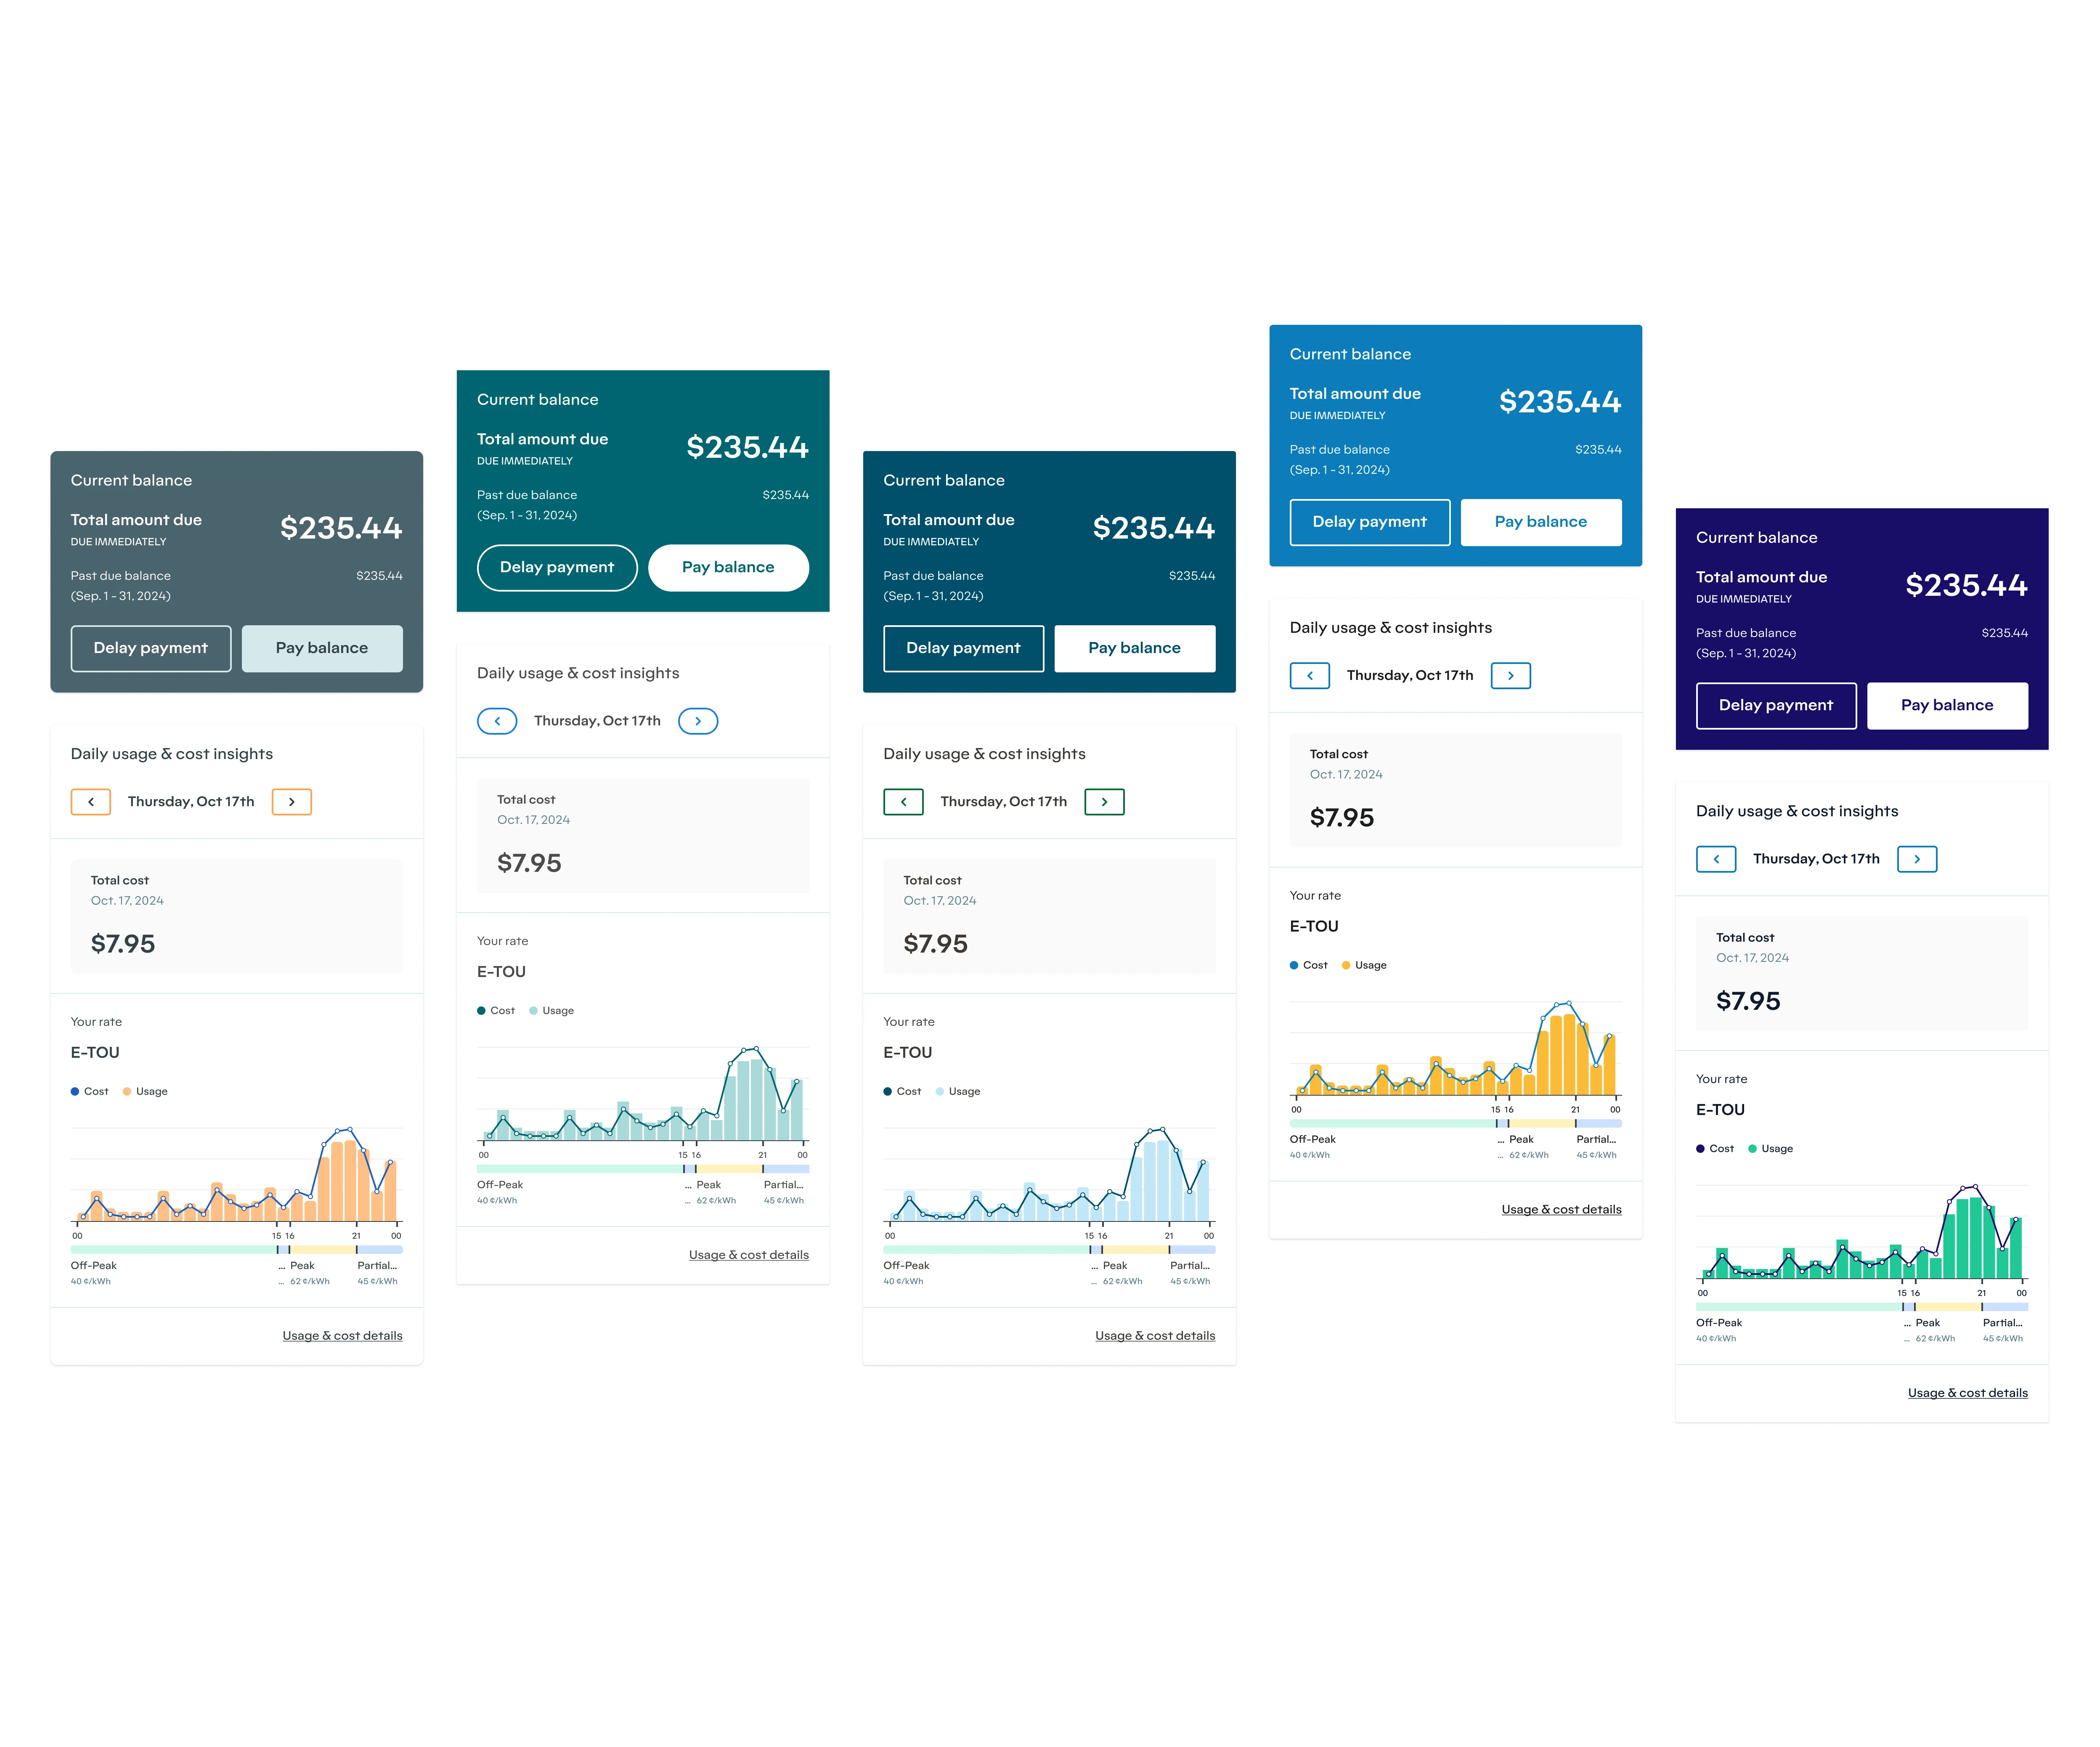
Design System and Theming
To meet our clients’ customization needs, I developed a design token system that allows us to quickly theme our applications to align with each utility’s brand, using seven key values. This enabled us to efficiently create custom experiences for no less than 19 different utility companies.
In addition, I designed chart and table components for our Design System, empowering the design team to create back-office reports for other products while also supporting the Empower product.
Outcome
The success of Empower was underscored by a seven-figure, 5-year deal with a large US utility, replacing an established competitor. This was a significant validation of our approach and the value of our solution.
Other outcomes included:
Widget library
Modular, customizable widgets that met the unique needs of our client and could be adapted for other utilities.
Improved customer journey
Improved customer journeys, guiding users from high-level overviews to actionable insights.
Increased interest
Increased interest in Empower, with several additional utilities expressing interest in our solution.